UVM Proctor Page
Tech helped boost yields in last decades
A look at the state of the industry and how it arrived at this point
By BY TIMOTHY D. PERKINS, M.L. ISSELHARDT AND A.K. VAN DEN BERG |
Pure maple syrup is a uniquely North American food product that is marketed worldwide. The last few decades have witnessed tremendous changes in the maple syrup industry in the U.S. and Canada. Production of syrup and marketing of syrup have risen dramatically, especially over the past decade.
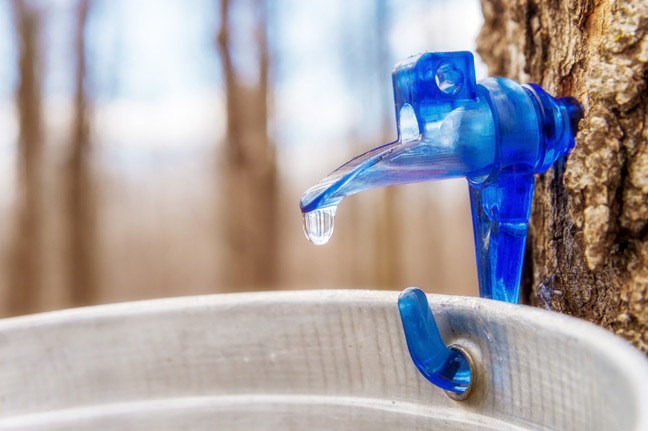
Technological improvements, particularly in vacuum delivery and in taphole sanitation have resulted in sharp increases in yield far above that achievable two decades ago, despite the widespread move from 7/16” to 5/16” or smaller spouts.
Maple operations with tens of thousands of taps are becoming more common – operations with over 100,000 taps are appearing.
It is important at this juncture to take a look at the state of the industry and how it arrived at this point. In a series of brief articles we will describe the U.S. maple industry and recent changes in terms of geographic distribution, production, yield, and pricing.
In this first article, we will focus on the production of maple syrup in the U.S. as reported in the 2012 Census of Agriculture. The Census of Agriculture is conducted every five years by the U.S.D.A. National Agricultural Statistics Service.
The section of the 2012 report describing maple can be found at: http://www.agcensus.usda.gov/Publications/2012/Full_Report/Volume_1,_Chapter_2_US_State_Level/st99_2_037_037.pdf
It is important to keep in mind that the Census of Agriculture is a snapshot of the industry at a single point in time. Maple syrup production (perhaps more than any other agricultural crop) is exceptionally dependent on a narrow window of weather.
The sap flow season 2012 was atypical in many areas in that it ended abruptly and fairly early and had lower production totals in comparison to the average.
Thirty U.S. states are listed as producing maple syrup in the 2012 Census of Agriculture (hereafter COA), ranging geographically from Maine in the east to Washington and Oregon in the west, and from Virginia in the south to Minnesota in the north.
The bulk of maple production occurs in the northeast and north central regions in states bordering or close to Canada. The remainder of this paper will primarily describe the characteristics of 19 of the 30 top maple-producing states.
The first figure shows the number of farms producing maple syrup in 2012 in each state. Seven (of 19) states (RI, NJ, KY, IA, WV, VI, and MD) had less than 100 farms producing syrup, four states (CT, MN, IN, MA) had between 150 and 300 maple producing farms, five states (MI, NH, OH, PA, ME) had 500-708 maple operations, and three states (WI, NY, VT) had over 1,000 farms that made maple syrup.
The number of taps in 2012 in each state is shown in the next figure. Ten (of 19) states (RI, NJ, KY, IA, WV, VI, MD, CT, MN, and IN) set out a total of less than 100,000 taps.
Six states (MA, WI, MI, NH, OH, and PA) collected sap from a total of 100,000-200,000 taps. Three northeastern states (NH, ME, VT) had between 200,000 and 4,500,000 taps each.
The average number of taps per farm is depicted next. The majority of states had maple operations averaging 1,000 taps or less. The average size of operations in this group of states was 461 taps per farm.
Only four states had an average number of taps greater than 1,000 per farm, including: MD (1,337 taps/farm), NY (1,414 taps/farm), VT (2,800 taps/farm), and ME (3,645 taps/farm). MD has only a relatively small number of maple farms, but they tend to be relatively large, whereas ME sugaring operations tend to be quite sizeable.
The final graph shows syrup production in 2012. Total U.S. production was nearly 2,300,000 gallons. Ten of the 19 states produced less than 12,500 gallons of syrup in 2012.
Six states produced between 40,000 and 100,000 gallons. NY produced over 360,000 gallons of syrup (15.6% of U.S. production). ME, with over 440,000 gallons, accounted for 19.3% of the total U.S. production.
At just under 1,000,000 gallons in 2012, VT produced 43.5% of the total U.S. maple crop.
IN THE KNOW
Ag census
Whether small or large, your agricultural operation is important to gain a complete measure of U.S. agriculture.
This includes retirement/lifestyle farms and ranches that grow a small amount of plants or crops or keep only a few animals, up to the largest of operations and everything in between.
To take part in the survery, go to http://www.nass.usda.gov/Online_Response/Be_
Counted/
The next segment of this series will examine industry growth over the past several years.
April 2015

