

Cornell Corner
Mainline sizing guidelines and worksheets for 1” line
By STEPHEN CHILDS, NYS MAPLE SPECIALIST |

The number of taps that can be properly supported on a one inch mainline depends on a number of factors including the line loss due to friction in the line, the length of the line, the slope of the line, sap volume in the line and vacuum capacity available to the line.
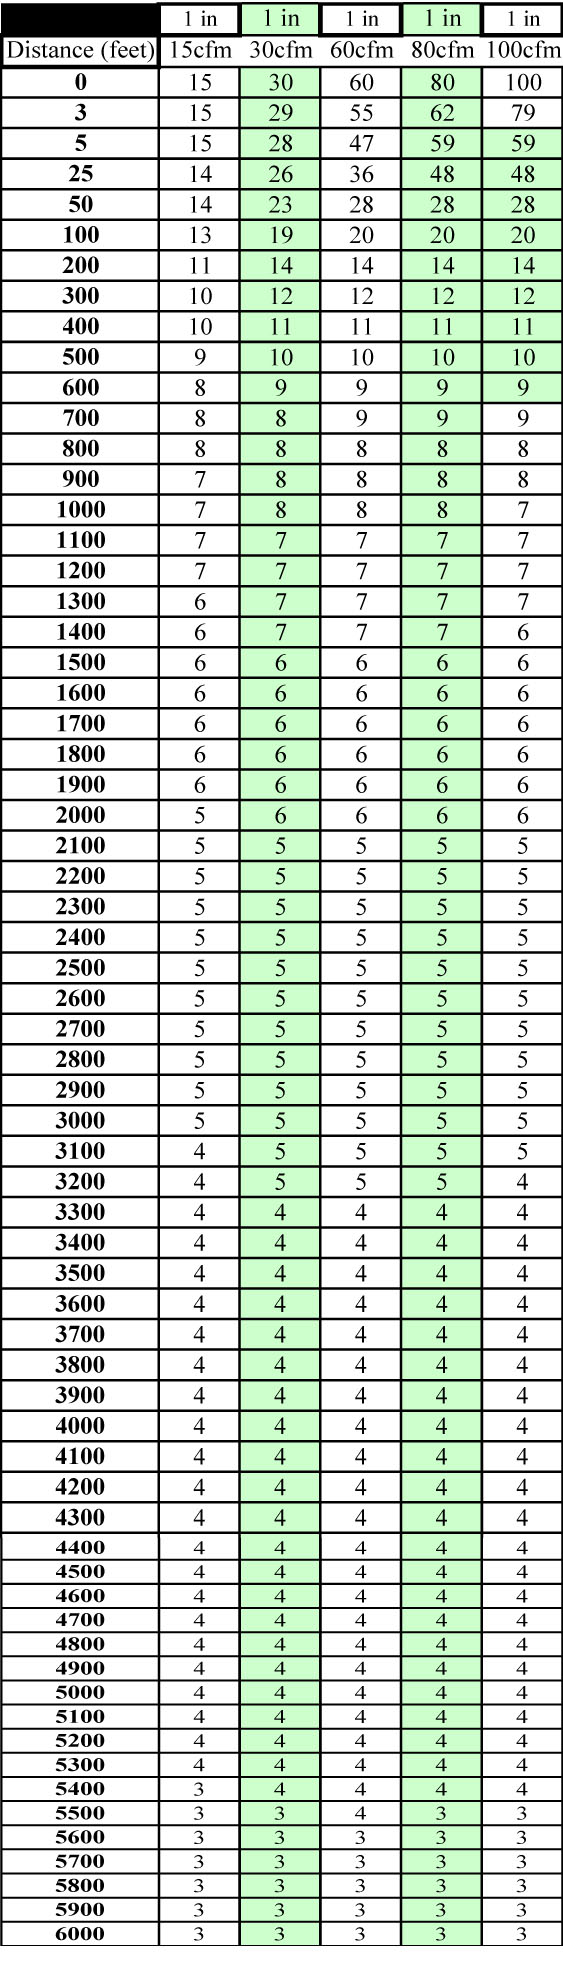
Chart 7 pairs together a one inch line connected to a 15, 30, 60, 80, and 100 cfm pump. In just 800 feet all of these one inch lines are supporting exactly the same cubic feet per minute capacity.
In the first 800 feet of line most of the significant line loss due to friction has occurred and no matter how big the vacuum pump connected to the line, the air flow in the line is essentially equal. From this information combined with sap flow calculations a set of guideline charts for various slopes are developed.
See Chart 1
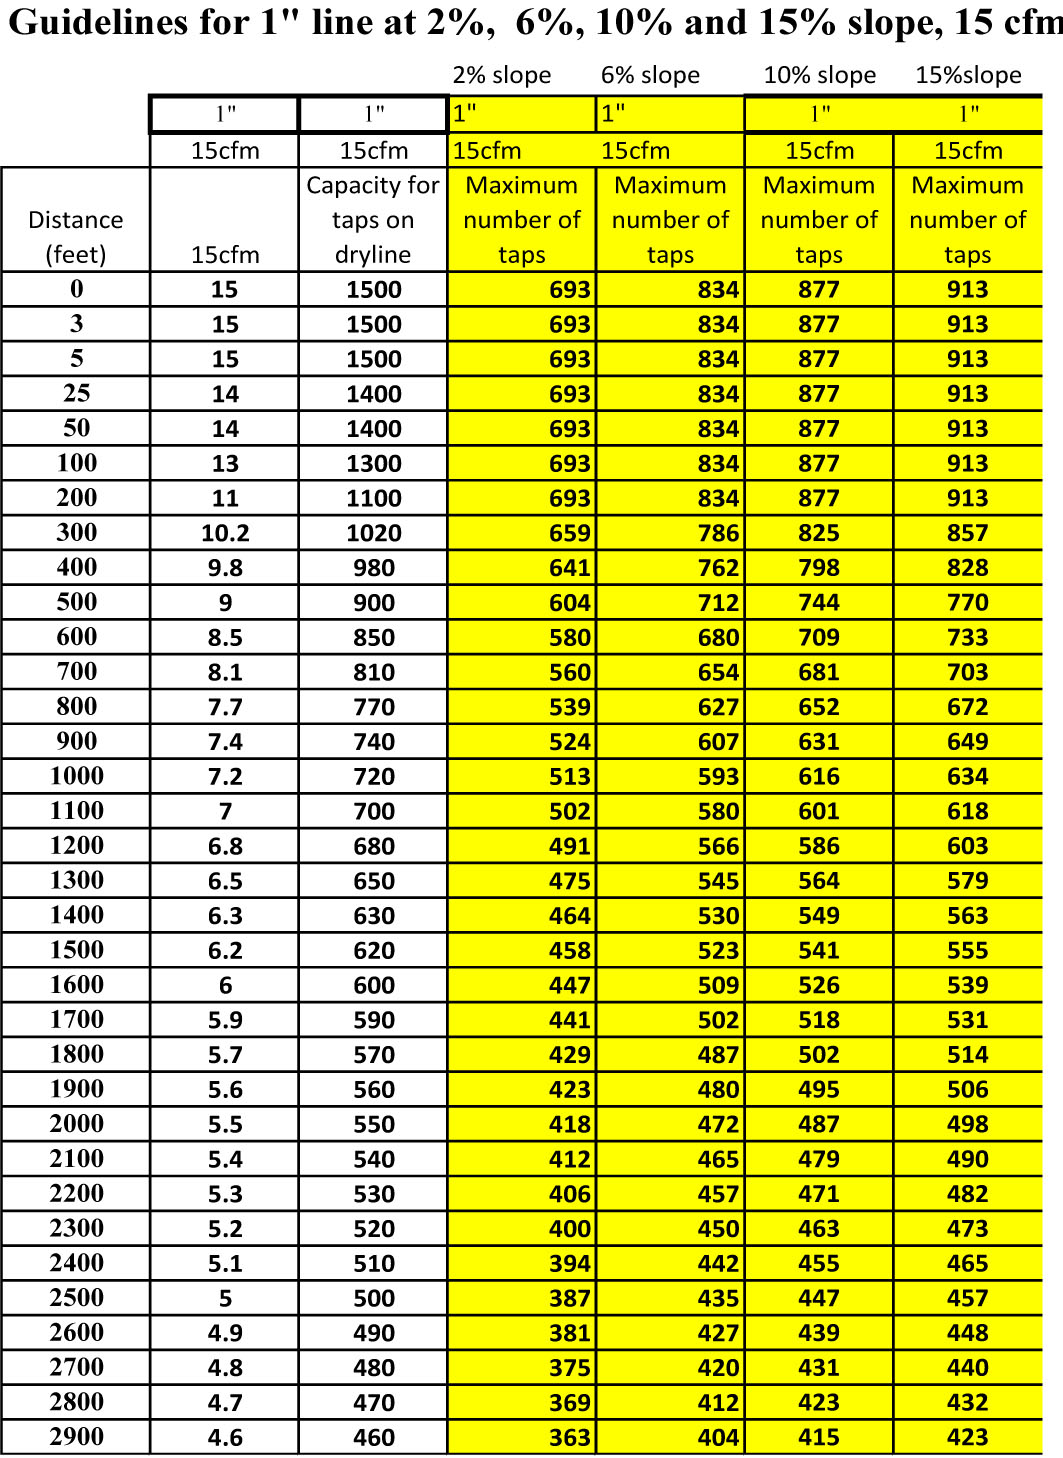
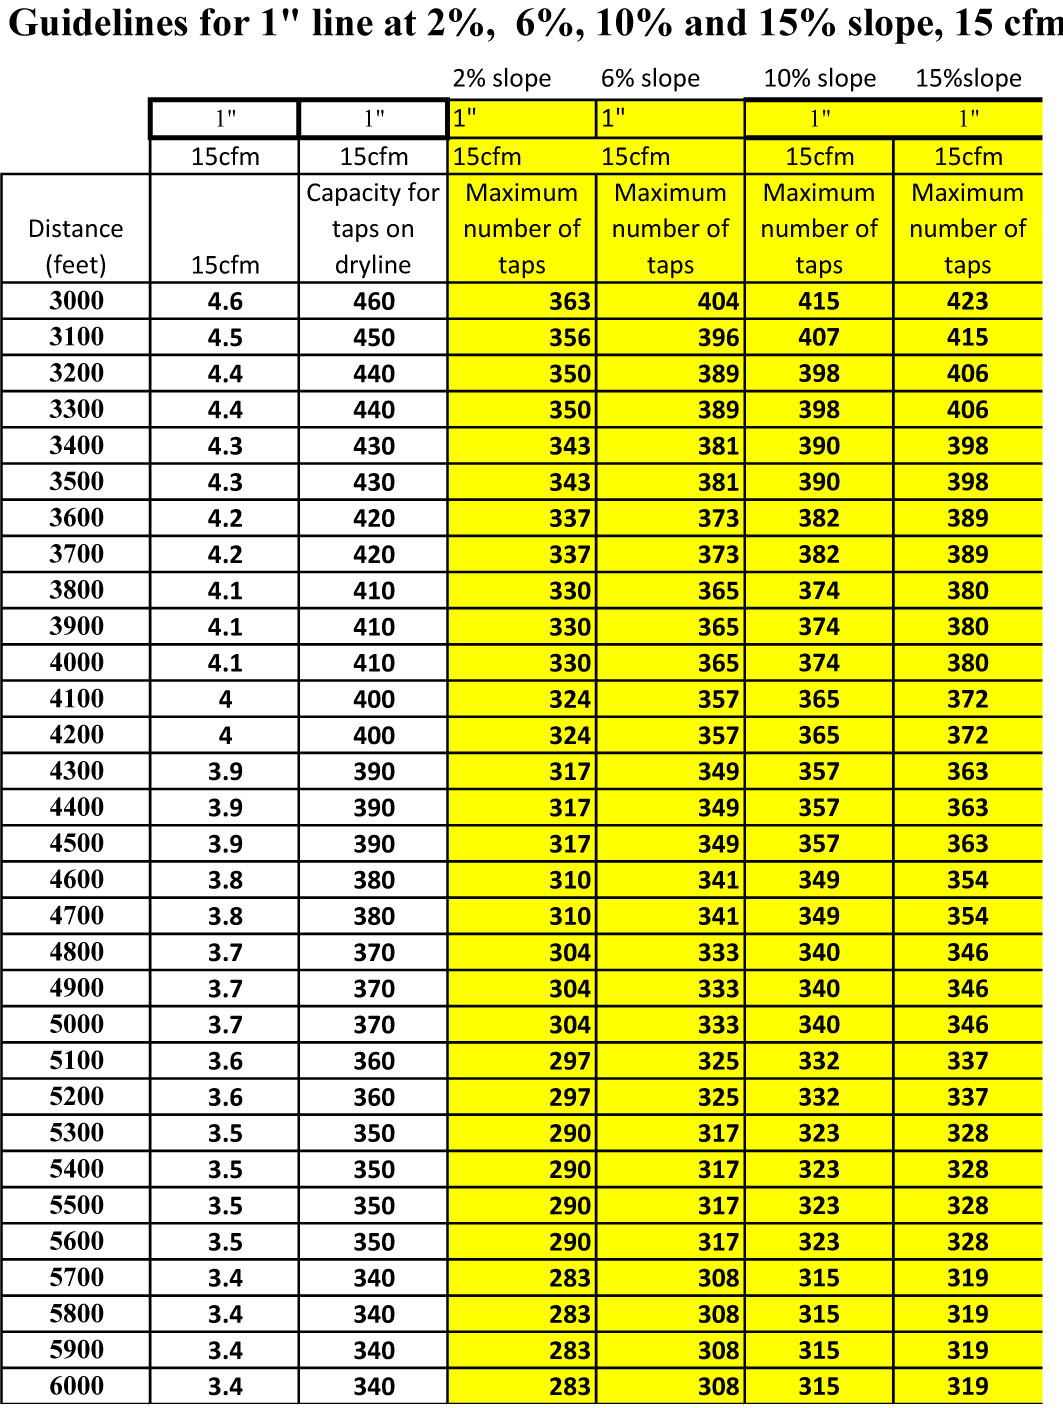
From the air flow line loss charts and water flow charts for 1” line, tables of guidelines based on a balance of air and sap flow in the line have been constructed. The first two columns show how long the tubing is and the cfm assigned to that line on the line loss chart.
See Chart 1
Column three shows how many taps can be on a 1” dry line of that length and the associated line loss. Column four shows the number of taps suggested for one 1” mainline at the listed length and cfm for near perfect balance between sap and air flow at 2% slope.
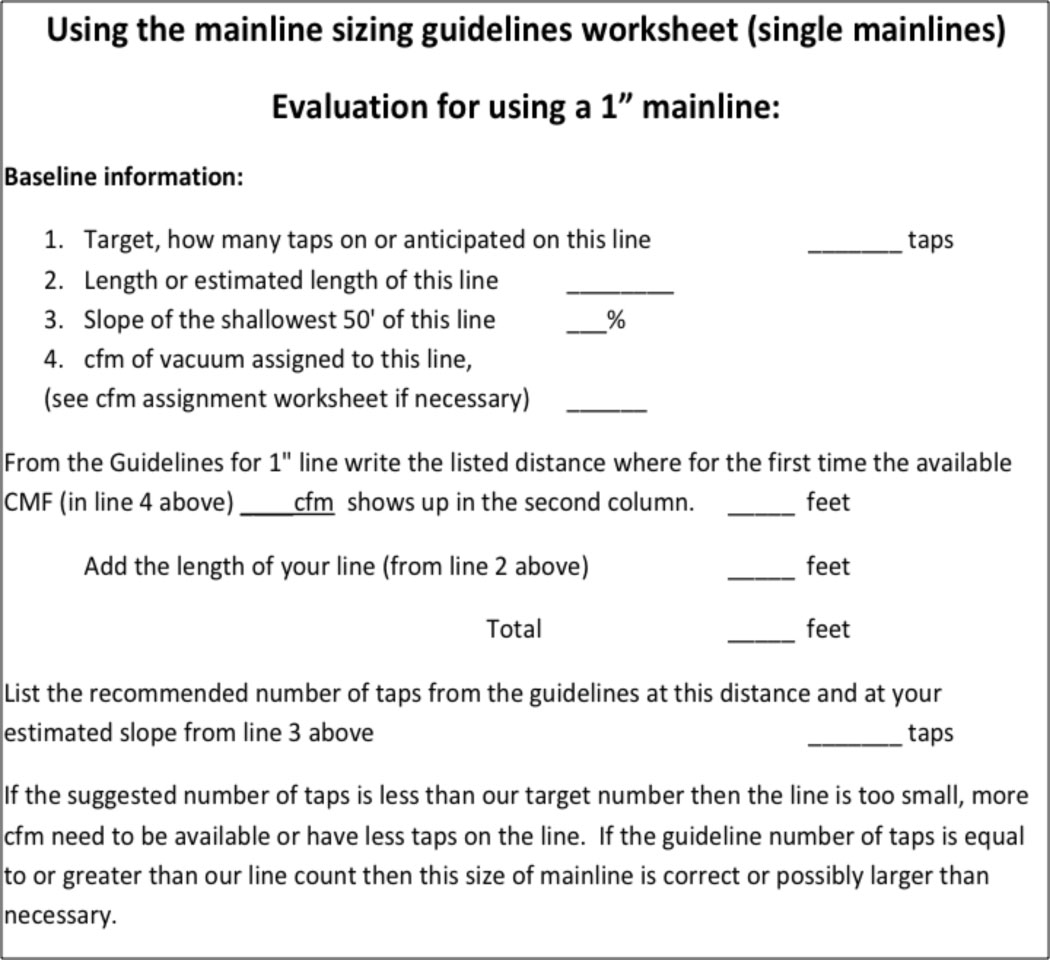
The following worksheet will provide the outline for using the chart to identify the ideal combination for any given mainline in the sugarbush.
It should also be noted that the tap numbers listed for the first 1000 feet are not realistic simply from the perspective that there is no way that many maple trees would be available within that distance.
See Chart 3
Many maple producers have decided to only use one size of mainline in the sugarbush. This reduces the number of fittings and repair parts they need to have on hand as well as carry into the woods when working on line maintenance. The extra volume in the 1” line compared to ¾”also allows for less problems from sap obstructing the line when there are slope variations in the woods.
However the bigger line does not allow for carelessness in installation or line maintenance. Sagging lines with variations of little more than the thickness of the line can create sap pooling that seriously restricts the movement of air through the lines. A good tight well graded system will assure better vacuum to the tap holes.
See Chart 4
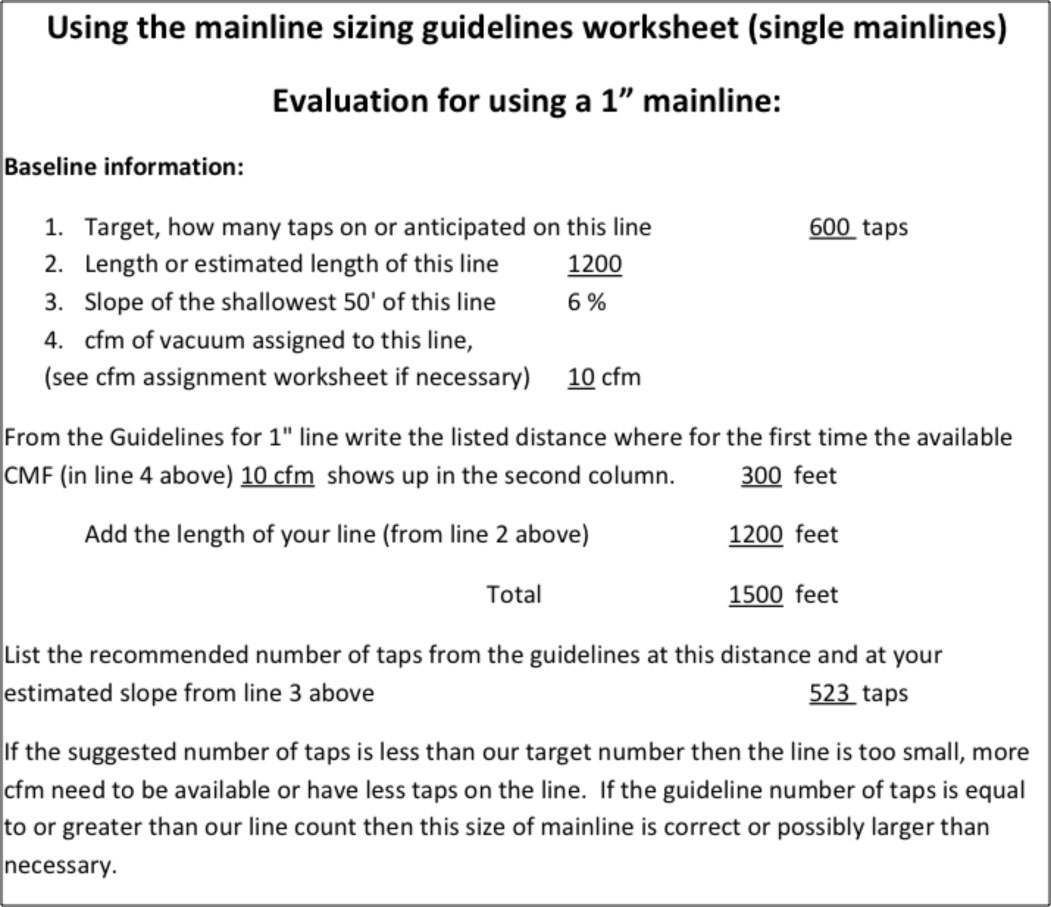
In this example there are 600 taps on the mainline. It is 1200 feet long at a 6% slope and has 10cfm of vacuum pump capacity available to the line. On the 1” Guidelines chart 10 cfm first show up at about 300 feet. From here we add the 1200 feet of this mainline to the total of 1500’ where the recommended number of the taps at 6% slope is 523 taps.
This mainline is not of sufficient capacity to service this many taps. Sap during a good flow would obstruct the flow of leakage air from the tap to the vacuum pump and reduce the productivity of the vacuum system.
If 15 cfm of capacity were provided to this line the distance reading would start at 0. Move down the chart to 1200 feet and the recommended number of taps at 6% slope is 566. This is still below the guideline and indicates that this many taps should not be on this one line.
Going to more than 15 cfm on the line would represent a significant loss of vacuum pump capacity to friction loss. 15 cfm at the beginning of the line and only 6.8 available after 1200 feet in a line not obstructed by sap shows over 50% of the pump capacity lost to friction. This does show that it could serve as a dry line.
The Guidelines take into account both the space needed in the line for sap and the space needed to conduct the flow of leakage air.
See Chart 5
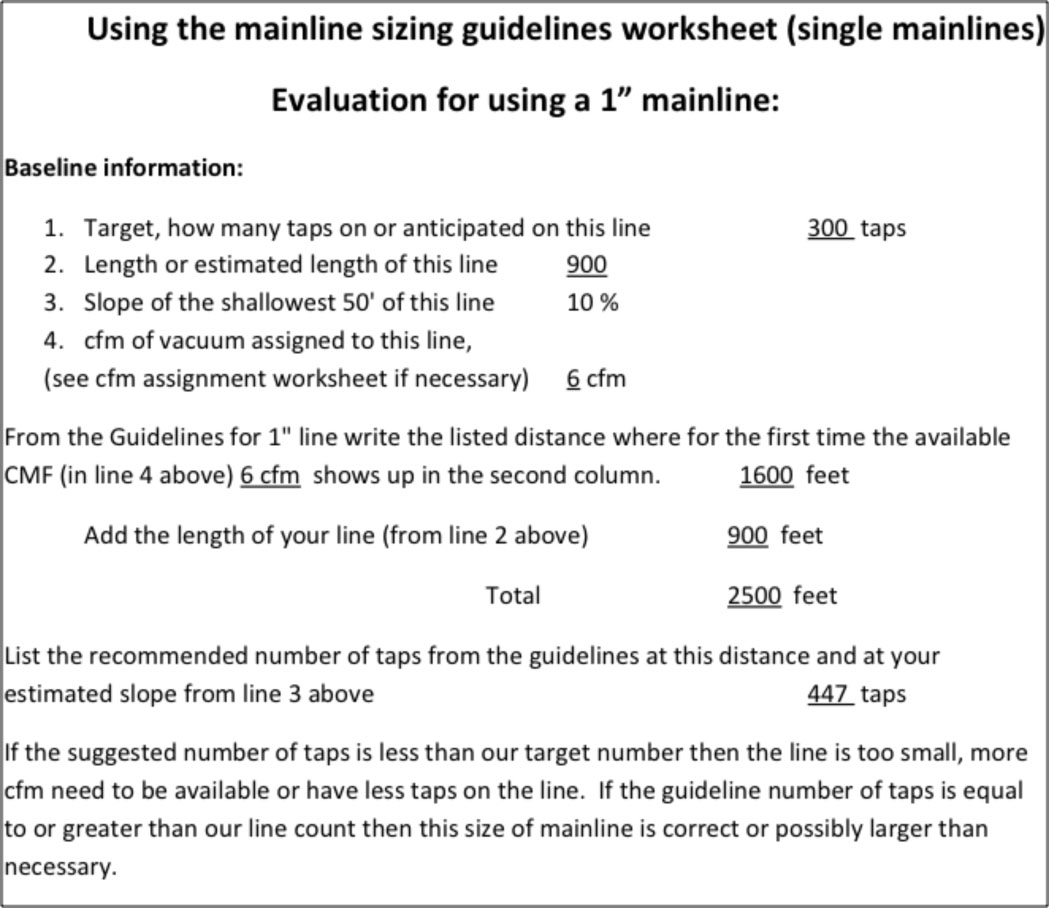
For this example there are 300 taps on a 1” mainline that is 900’ long with a consistent 10% slope. The line is connected to a vacuum pump capacity of 6 cfm.
On the 1‖ Guidelines chart 6 cfm first appears at about 1600’. To 1600’ add the length of this mainline (900’) for a total of 2500’. On the chart at 2500’ the recommended number of taps is 447 taps at a 10% slope.
This number of taps is significantly more than the 300 taps available to the mainline. This would indicate that more taps could be added to this line if more are available. An evaluation could be done looking at using ¾” line. The capacity of the vacuum pump could be directed elsewhere in the system.
Note in the charts that more taps can be added when the slope of the mainline is greater. This simply reflects the fact that more sap can pass through a steeper line in the same amount of time. It is important to note that the steeper slope, in order to give this improved performance must be consistent for the whole length of the line.
For example, if the slope of the line is 20% for 3/4s of its length then 10% for the remaining quarter, you should consider the capacity of the line to be at the shallower slope.
In fact that slope variation may make the line function at even a lower level. Sap tends to back up and act as an obstruction to the movement of air when the pace of sap flow makes a change.
See Chart 6
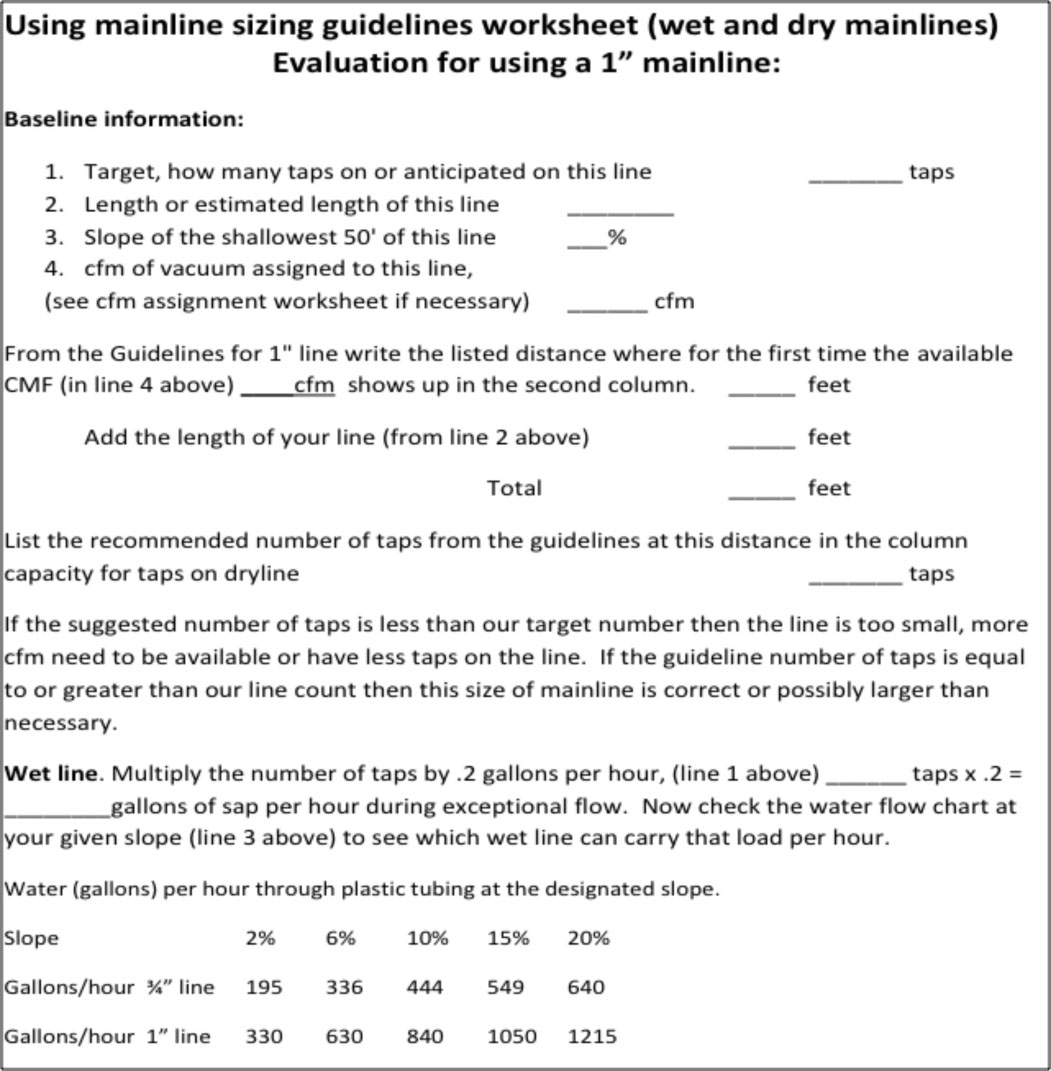
This is the worksheet for a dry line/wet line system. The evaluation for the dry line part of the system is similar to following the worksheet for single main lines except the dry line column is used.
To evaluate the wet line, multiply the number of taps by the .2 gallons of sap per hour per tap estimation for exceptional flow and compare the gallons of anticipated sap flow to the pipe flow capacity estimations at the bottom of the worksheet. These estimations are based on unobstructed pipe which is not usually the case in a maple tubing system.
Fittings, elbows, air pockets and slope variations all act as obstructions to sap flow. You would not want to have a wet line operating near its rated full capacity. When the sap flow calculation for the wet line shows it nearly full, such as over 75%, moving to a larger line would be suggested.
In a wet line, unless it is specifically oversize to add air flow capacity, its air flow is not calculated or added.
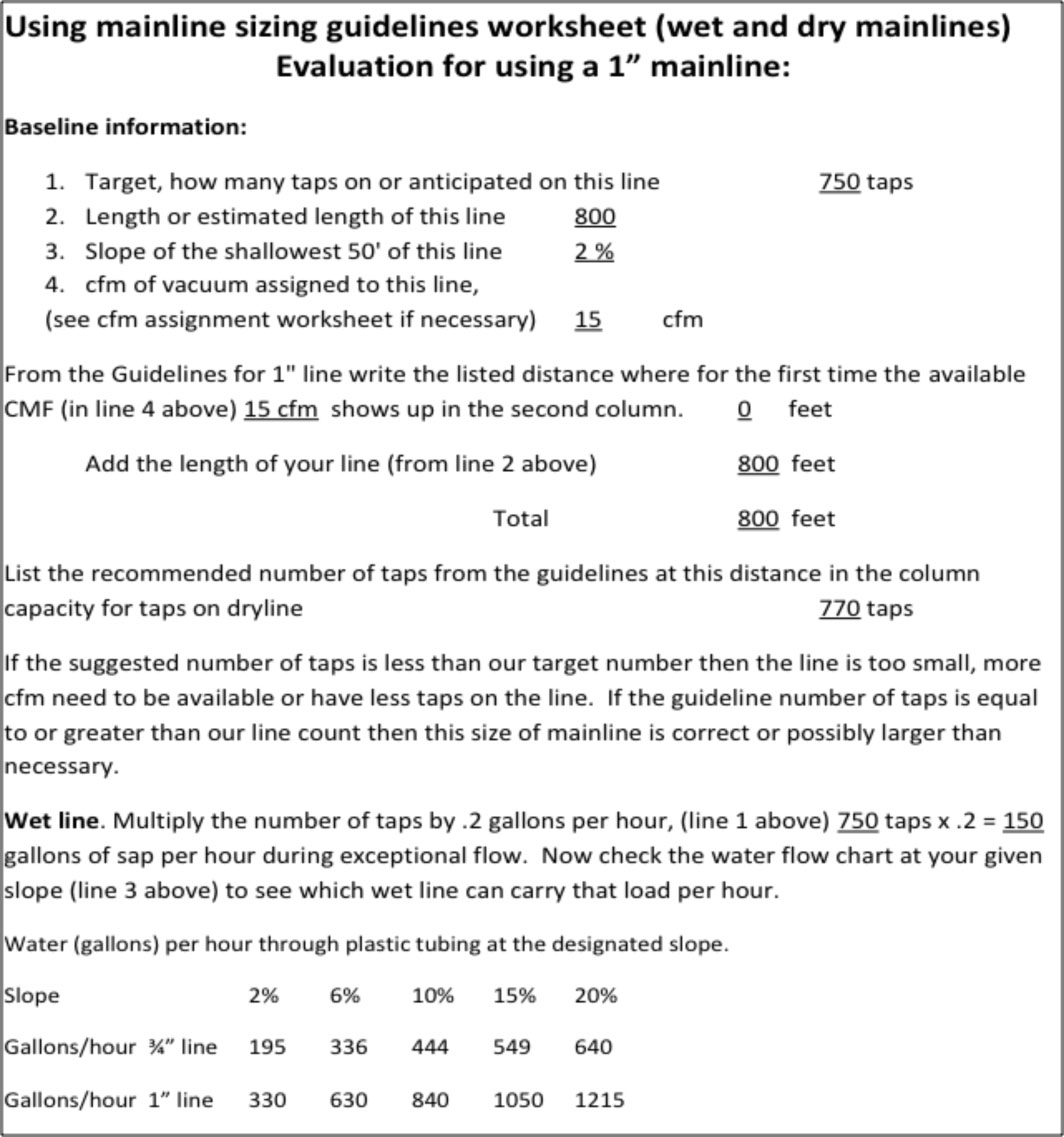
In this example there is 1” dry line 800’ long with a 2% slope with 750 taps and a connection to 15 cfm of vacuum pump capacity. On the Guidelines chart for 1” mainline the first place 15 cfm appears is at a distance of 0. Add the 800’ length of this mainline to the 0’ in the chart and read from the third column the capacity for taps on dry line at 770 taps. One inch dry line under these conditions has sufficient capacity. Then multi-ply the 750 taps times the .2 gallons of sap per hour estimate during excellent flow. Total sap flow is 150 gallons. From the chart at the bottom of the worksheet at 2% slope either the ¾” at 195 gallons per hour or the 1” lines at 330 gallons per hour would be acceptable. During a good run the 3/4‖ line could be over 75% full indicating that the 1” line may be the better choice.
See Chart 8
June 2013


Fall
Sale!
© 2026 The Maple News